EarlyLayers 2-9
Input-form separation. Expert selection differed by input form.
Expert selection differs in layers 2 to 9. Expert lists become more similar for matching transcripts in layers 10 to 34.
The router assigns each token to six experts. We compare the expert IDs across speech, image, and text.
In layers 2 to 9, the selected IDs differ by input form. Between layers 10 and 34, the lists become more similar. After layer 35, the router often selects similar lists for all three input forms.
Changing the early expert groups increases loss for every task. Similar expert lists do not prove that the hidden states have the same meaning.
Inkling-Small has one decoder for all three input forms. It has no separate vision or audio Transformer.
The router assigns each token to six of 256 experts. An expert is a small processing block inside the decoder.
We provided the same sentence as speech, a rendered image, and text.
We recorded expert selection at each decoder layer. We then changed expert groups and measured task loss.
Expert selection identifies the active processing blocks. It does not measure similarity between internal representations.
Select text, image, or audio. Then select one token. The chart lists the six selected experts at four layers.
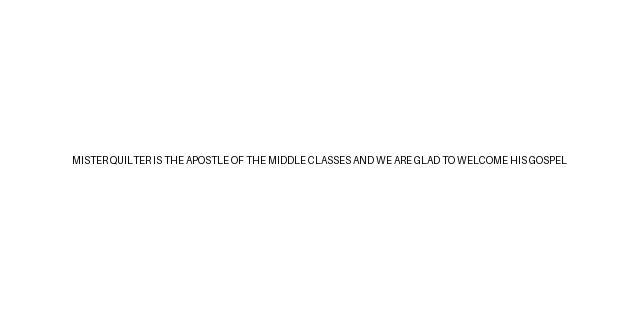
MISTER QUILTER IS THE APOSTLE OF THE MIDDLE CLASSES AND WE ARE GLAD TO WELCOME HIS GOSPEL
A left mark indicates a leading space.
The experiment rendered this transcript at 640 by 320 pixels.
Evenly sampled across the image-token sequence
Sampled across 5.855 seconds.
Read from top to bottom. Each block is one selected expert. Block width represents routing weight.
For this token, E3 has the highest weight at layer 2. E163 has the highest weight at layer 41. No expert ID repeats between consecutive shown layers.
The six saved weights add to 100% in each row. Color identifies the expert ID.
We tested 18 transcripts. Expert selection differed by input form in layers 2 to 9.
In layers 10 to 34, matching transcripts produced more similar expert lists.
After layer 35, the same expert groups often received tokens from all three input forms.
This pattern is consistent with a transition from input-form processing to cross-modal content processing. Latent similarity requires activation-level measurements.
Six transcripts identified the expert groups. Twelve different transcripts tested each change.
Input-form separation. Expert selection differed by input form.
Matching transcripts. Expert lists were more similar for inputs with the same transcript.
Similar lists. Expert lists were often similar across input forms.
Route similarity alone does not establish causal importance. We blocked each group and measured the change.
We also swapped early groups between speech, image, and text.
The control condition changed other experts with similar overall use.
“Worse” marks a clear loss. “No clear change” includes small or uncertain differences.
| Task | Early | Middle | Late |
|---|---|---|---|
| Read speech | Worse | No clear change | No clear change |
| Read image text | Worse | No clear change | No clear change |
| Predict text | Worse | Worse | No clear change |
This score measures whether two inputs contain the same words. Higher values indicate better retrieval. The control value did not decrease.
In four generated examples, speech word error rose from 4.8% to 10.0%. Image-text character error rose from 0% to 4.7%.
Expert selection differed by input form in layers 2 to 9. Blocking these groups increased loss for every task.
Expert lists for matching transcripts became more similar in layers 10 to 34. Changes in this range increased only text-prediction loss.
Expert lists were often similar across input forms after layer 35. Changes in this range had no clear effect.
These results measure convergence of expert selection across input forms. They do not measure convergence of internal representations.
A latent-alignment test requires expert activations for matching inputs at each layer.